
Drawings & plans
Once your cave is surveyed and calculated, you can draw professional cave plans! CaveRenderPro offers comprehensive drawing tools with a symbol database, patterns, line styles and much more.
Managing drawings
Open the tab Drawings (or press Ctrl+W) to manage drawings.
The drawing table
Every cave plan consists of several drawings placed on top of each other. Every drawing is a separate level. Here is an example:
- Border – page layout and title
- Legend – symbols and explanations
- Labels – texts and depth values
- Survey shots – survey traverses with the station numbers
- Cave elements – lines, areas, stones and symbols
- Passage outline – the outer boundary of the passages
- Passage fill – background colour
This division has advantages:
- Drawing parts of the cave that overlap each other
- You can show and hide individual levels
- Drawings can be exported and imported individually
Creating a new drawing
- Click on Drawings → Drawings → New (or the right mouse button in the table)
- Enter a name (e.g. "Passage outline")
- The new drawing appears in the table
- The topmost selected drawing is the active one (you can only draw in it), the others are shown in grey
Drawing elements
The tab Elements (Ctrl+E) is your drawing workshop. Here you draw with the various elements.
Lines
With the various line styles and line types you draw outlines, structures and special elements:
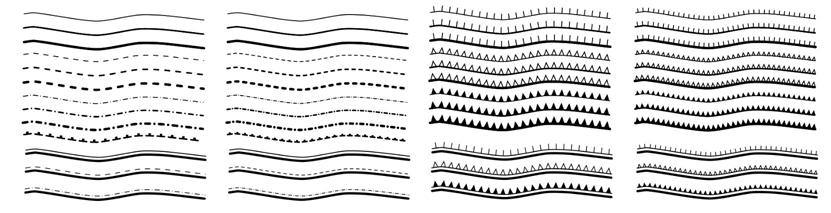
How to draw a line
- Go to Elements → Lines/Fill and choose the line type (wall line, entrance line, etc.)
- Draw the line with the mouse button held down
Line types by function
| Line type | Description |
|---|---|
| Line | Line (0.75 pt) |
| Wall line | Wall line (1.5 pt) |
| Entrance line | Entrance line (2.5 pt) |
| Double entrance lines | Two parallel entrance lines |
| Polyline | Line with pointed corners |
| Contour | Isoline |
Line styles
Every line type can be drawn with different patterns:
- Continuous line – normal, continuous line
- Dashed line – interrupted dash pattern
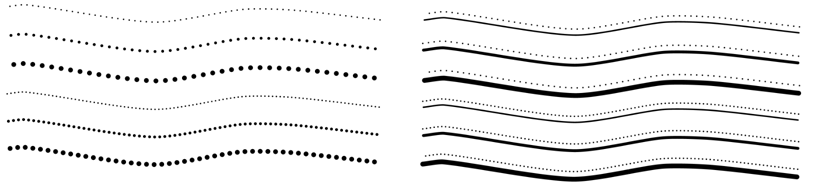
- Dotted line – dotted line
- Dash-dotted line – alternating dashes and dots
Line type and line style can be combined freely – here dotted lines of various widths, partly together with continuous lines:
Special lines
Every line type can additionally be drawn with a line symbol that marks the structure along the line:
- Pit – edge of a pit
- Step – step in the passage
- Ceiling – ceiling edge
- Sinter pool – rim of a sinter pool
- Underlaying – underlying structure
Two options control how the line symbols are displayed:
- Half sized line symbols
- Invert line symbols – show the line symbols on the other side (select the lines with
W, then pressI)
Polylines vs. normal lines
CaveRenderPro distinguishes between two line styles:
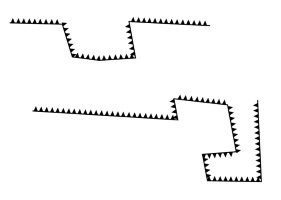
| Line type | Corners | Use |
|---|---|---|
| Normal lines | Rounded corners | Soft, flowing contours (natural passages) |
| Polylines | Pointed, sharp corners | Clear, precise outlines (mines, quarries) |
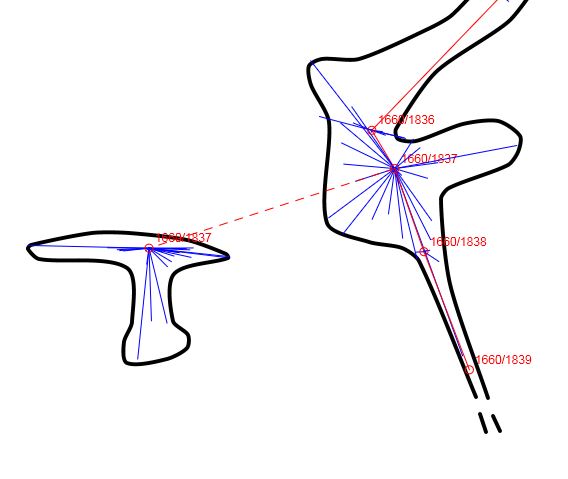
Survey elements (stations, lines, cross-sections)
For depicting survey data in drawings. Survey shots are usually inserted automatically with Drawings → Survey Shots → Transfer.
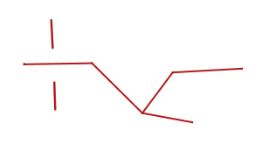
| Survey element | Description |
|---|---|
| Survey stations | Survey stations and reference points |
| Survey shot (continuous) | Normal survey shot |
| Cross-sections | LRUD and cross-section lines |
| Survey shot (dashed) | Shows the connection between a survey station and a cross-section |
Symbols
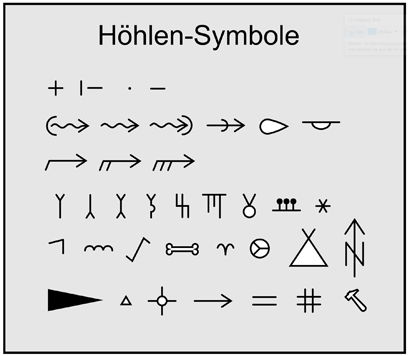
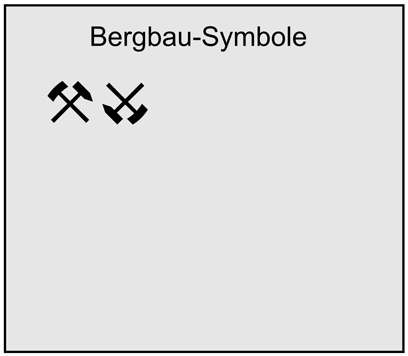
CaveRenderPro has built-in symbols and a comprehensive UIS-compatible symbol database.
Fixed symbols
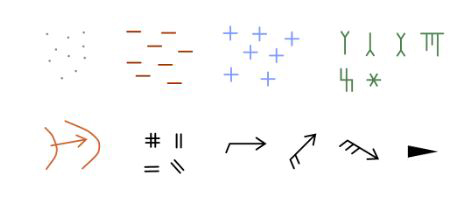
Symbols with a fixed orientation – click once to insert them:
- Sand – sandy areas
- Mud – muddy areas
- Snow, ice – areas of snow and ice
- Stalactite – dripstone hanging from the ceiling
- Stalagmite – dripstone standing on the floor
- Stalagnate – joined stalagmite and stalactite
- Straw – tube-shaped sinter
- Helictite – irregularly grown sinter
- Crystals – crystal formations
Rotatable symbols
Symbols with a variable direction – hold the click and drag the direction:
- Entrance – entrance arrow
- Slope – direction of the slope
- Narrow – direction of the squeeze
- Light breeze, Moderate breeze, Strong breeze – air flow with direction and strength
Defining colours
Colours for symbols and elements can be set in three places:
1. Colours
In the tab Elements you find tools for managing colours:
- Drawing colour: colour picker for the colour of lines and symbols
- Filling colour: colour picker for the fill colour
- Colour Template: selection list of the stored colour templates; the name of the selected template can be changed
- Keep colours: normally the drawing and filling colour take on the default colour of the element or symbol when you switch to another one. With this switch the colours you have set are kept
2. Default colours
Here you can change the default symbol colours:
- Open File → Properties → Colours
- Define the default colours for the various symbol categories
- These settings apply globally to all newly inserted symbols
3. Symbol database
In the settings of the symbol database you can adapt the UIS standard symbols:
- Open the symbol database settings under File → Properties → Symbols
- Adapt the colours and sizes of individual symbols
The symbol database Symbol Import DE.xml (and likewise for CS, EN and FR) is included, as well as a sample drawing Demo Symbole.xml.
Patterns
Patterns for filling areas and for depicting materials and structures:
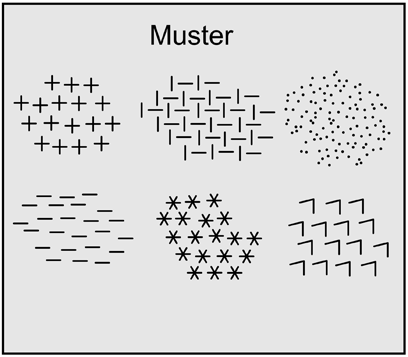
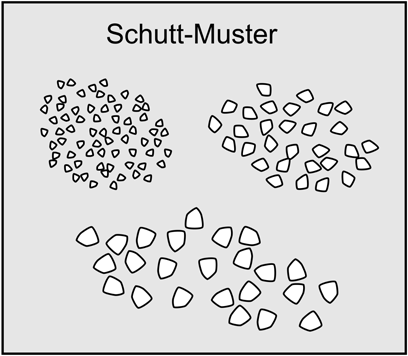
Draw patterns either:
- Freely – paint with the mouse for free-form areas
- Automatically – click on a closed area (like filling a passage)
Stones and rocks
In the group Stones you draw blocks of different shapes. You set the size of the stones with Stone size (cm):
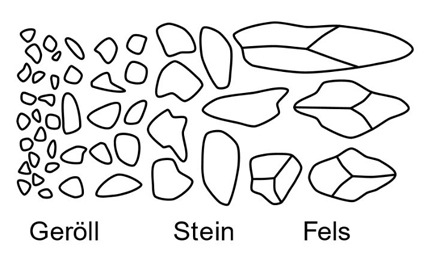
- Debris (4-5 sides) – small, angular debris
- Stones (8 sides) – normal stones and blocks
- Rocks (12 sides, contour) – large blocks of rock with a contour
While inserting them, you can drag stones and rocks with the mouse button held down and thus stretch them up to four times their length.
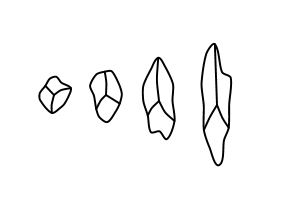
For stones you draw yourself there are two kinds of line:
- Stone line (rounded)
- Stone line (pointed)
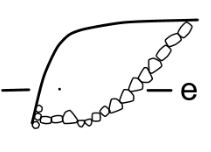
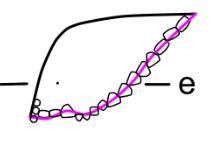
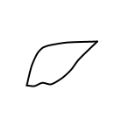
Wall line for small zoom factors
For closing the outline at smaller zoom factors there is a special element. Use it with open outlines to close gaps before you fill them:
Filling a passage
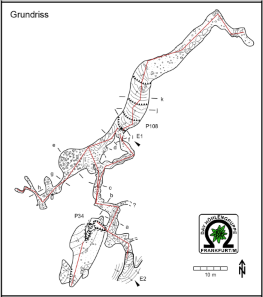
Fill closed areas of a passage automatically with a colour or a pattern:
- First draw a closed wall line
- Filter wall and entrance lines
- The filter hides the drawing grid, the sketch, the survey shots and the other drawings, and switches Fill passage on automatically
- Click close to the outline, inside the area you want to fill
- The colour or the pattern is inserted automatically
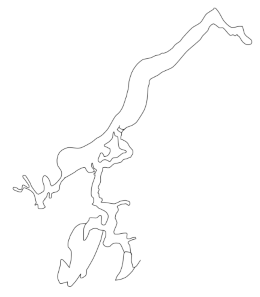
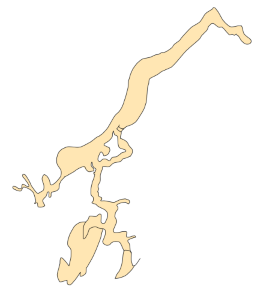
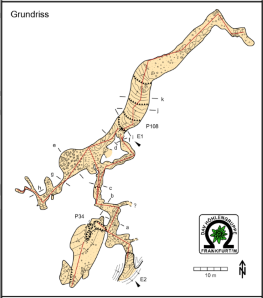
You delete the fill with the Esc key or with Elements → Elements → Select.
Sources of error when colouring a passage
- Too small a zoom leads to untidy results
- Too thin an outline leads to wrong markings
- A mouse click close to a symbol, a text or another element leads to wrong markings
- Symbols that are connected to the outline are not filled
- If the outline is not closed, the visualization area serves as the boundary
- Clicking on a colour other than the background colour does not work
- Clicking on an area that has been deleted does not work
Running water
For running water there are five widths. The value in brackets is the width of the watercourse used when drawing:
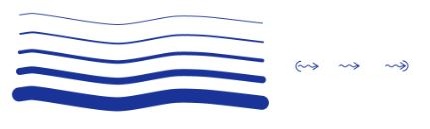
- Brook (6 cm) – very narrow trickle
- Brook (12 cm) – narrow brook
- Brook (25 cm) – wider brook
- Stream (50 cm) – stream
- River (100 cm) – larger cave river
- Dashed – presumed watercourse
Source, ponor and flow direction
Additional water symbols:
- Source – place where water emerges
- Ponor – place where water sinks
- Flow direction – arrow indicating the direction of flow of the water. Set several arrows along longer courses so that the course is unambiguous
Water and water bodies
Special patterns for water and water bodies:
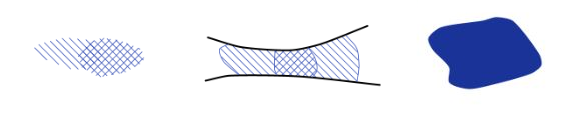
- Water – hatching for areas of water
- Siphon – hatching for submerged areas (sumps)
- Lake – standing water
Draw areas of water either:
- Freely – paint with the mouse for free-form water bodies
- Automatically – click on a closed area (like filling a passage)
Text and labels
Adding texts:
- Choose Elements → Text
- Click on the place where the text should be
- Type in your text
- Ctrl+Enter (multi-line) or Enter to finish
Text formatting
In the group Text you set the formatting:
- Font 1, Font 2, Font 3 – the presets are Arial, Courier and Times New Roman (can be changed in File → Properties → Fonts)
- Text size (pt) – font size in points
- Normal, Bold, Italic – font style
- Left-aligned, Centered, Right-aligned – alignment of the text
Text with variables
You can insert automatic cave information into your texts:
$length– total length of the cave in metres$depth– vertical depth (maximum difference in height)$low– lowest point$high– highest point$expansion– horizontal extension
Example: "Cave length: $length m" is displayed as "Cave length: 1,234.56 m"
Design
In the group Design you find the elements for creating the plan:
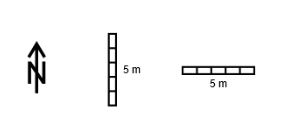
- Header – header area of the plan with the cave data
- Grid – coordinate grid
- Grid horizontal – grid for extended and projected profiles
- North arrow – direction of north on the plan
- Scale horizontal / Scale vertical – scale bar, adapts to the scale of the plan
Inserting images and logos
With the bitmap element you insert logos, legends or photos into the drawing:
- Bitmap – insert the image with the correct aspect ratio
- Bitmap scaled – insert the image scaled to the given size
- Choose Bitmap or Bitmap scaled
- First drag a rectangle of the size you want
- Choose the image file (
*.jpgor*.png)
You scale the selected bitmap in the element dialog or with Ctrl+mouse wheel (slowly) or Shift+Ctrl+mouse wheel (quickly).
When the drawing is exported, the SVG format contains the file paths of the bitmaps, while the PDF format contains the bitmaps themselves.
Free shapes
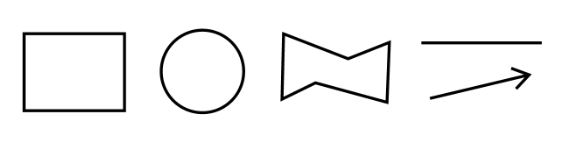
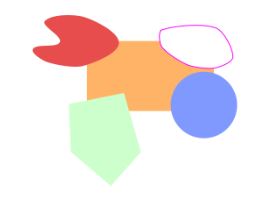
In the group Design you draw free shapes. You set the line width with Line width (pt):
- Straight – straight line
- Pointer – line with an arrow head
- Curve – freehand curve
- Rectangle, Polygon, Circle – outlines
- Fill rectangle, Fill polygon, Fill circle – areas in the filling colour
Drawing with sketches
Loading a sketch as the background
You can load field sketches as a template. CaveRenderPro supports many formats:
| Format | File extension | Source/application | Notes |
|---|---|---|---|
| Bitmap | *.jpg, *.png | Photos, scans | Is placed in the centre of the screen and shown semi-transparent |
| DXF | *.dxf | PocketTopo, TopoDroid | Vector graphic, origin at the cave entrance |
| SVG | *.svg | Qave, SexyTopo | Vector graphic, origin at the cave entrance |
| Cloud | *.csv, *.txt | Point clouds | Format: //X,Y header, then the number of points, then X,Y per line (max. 5000 points) |
A sample file is included for every format: Skizze Bitmap.png, Skizze PocketTopo.dxf, Skizze Qave.svg, Skizze SexyTopo.svg and Skizze Cloud.txt.
How to load a sketch:
- Go to Drawings → Sketch → Load
- Choose the sketch file
- The sketch is loaded as the background
- You can now draw on top of it
Modifying the sketch
The sketch can be moved, scaled, rotated and mirrored:
- Move:
Ctrl+Kor Drawings → Sketch → Modify - Mirror:
Ctrl+Lor Drawings → Sketch → Mirror - Scale:
Ctrl + mouse wheel(slowly) orShift+Ctrl + mouse wheel(quickly) - Rotate:
Alt + mouse wheel(slowly) orShift+Alt + mouse wheel(quickly)
The angle of rotation is shown in the status bar. The keys are the same as for rotating and scaling drawing elements, and here too the mouse pointer shows what is happening: an arc with two arrows for rotating, a diagonal double arrow for scaling.
Point clouds as sketches
You can also load point cloud data (e.g. from laser scans or drone surveys) as a sketch:
- Prepare a CSV or TXT file with the following format:
- First line:
//X,Y(header) - Second line: the number of points (e.g.
5000) - From the third line: coordinates (e.g.
12.5,45.3)
- First line:
- Go to Drawings → Sketch → Load
- Choose the CSV/TXT file (a maximum of 5000 points is read in, evenly distributed)
- The point cloud is shown as a background sketch
- You can draw on top of the point cloud or modify it like a normal sketch
Example file format:
//X,Y
3
10.5,20.3
11.2,21.5
12.1,22.8
A sample file Skizze Cloud.txt is included.
Tip: This is ideal for:
- Laser scans of a cave surface
- Drone surveys of the surroundings
- Detailed recordings of particular areas
- Documenting objects (e.g. blocks of rock, damage)
Transferring survey shots into the drawing
The survey shots of the line views are not themselves part of the cave plan. But they can be transferred into a drawing:
- Optional: if not all survey shots should be transferred, filter them beforehand with Drawings → Survey Shots → Selection by passage number, level number or year (e.g.
Passage 4,5,8-10) - Go to Drawings → Survey Shots → Transfer
- The survey shots and the station numbers are inserted
After the transfer, survey shots and station numbers can be deleted in the tab Elements if required, and the station numbers can be moved.
Editing elements
Selecting and moving an element
In the tab Elements:
- Press the
Wkey (or go to Elements → Elements → Select) - Click on the element you want to move
- Press the
Ekey (or go to Elements → Elements → Move)
With Move you can move, scale and rotate elements:
- Move – drag to the new position with the mouse button held down
- Scale –
Ctrl+mouse wheel(slowly),Shift+Ctrl+mouse wheel(quickly) - Rotate –
Alt+mouse wheel(slowly),Shift+Alt+mouse wheel(quickly)
Rotating and scaling happen around the mouse position – so the point under the mouse pointer stays where it is. The mouse pointer shows what is happening: an arc with two arrows for rotating, a diagonal double arrow for scaling. The angle of rotation is shown in the status bar.
Ctrl+Alt has no function there. When drawing and selecting, the mouse pointer first shows the selection shape while the key is held; as soon as you turn the wheel, it changes to rotating or scaling and stays that way until the next mouse click.
In the draw and the select tool you can also move temporarily with the Shift key held down, without switching tools. After releasing it you are back in the previous tool.
Selecting several elements
In the select mode (W key) you select several elements in three ways. The modifier key determines the shape, the mouse button the effect:
| Shape | Add | Remove |
|---|---|---|
| Rectangle | left mouse button or Ctrl + left mouse button |
Ctrl + right mouse button |
| Lasso | Alt + left mouse button |
Alt + right mouse button |
| Polygon | Ctrl+Alt + left mouse button |
Ctrl+Alt + right mouse button |
- Rectangle – drag a rectangle over the elements with the mouse button held down
- Lasso – move freely around the elements with the mouse button held down
- Polygon – drag edge by edge; a click without moving completes the polygon
An element counts as hit when its reference point lies inside the shape you have drawn. The mouse pointer shows the shape (a square for the rectangle, a lasso or a pentagon for the polygon) and the effect: + for adding, - for removing.
With Esc you cancel a polygon you have started.
Rectangle (Ctrl), Lasso (Alt) and Polygon (Ctrl+Alt) are also available in the Draw and the Move tool – so you do not have to switch to Select first. As long as you hold one of the keys, nothing is drawn or moved; instead a selection is made.
Esc.
Changing element properties
In the dialog "Element" you can change:
- X and Y coordinates: position on the plan
- Width and height: for rectangles, straight lines, arrows
- Radius: for circles
Deleting an element
Select the element and press Del (or Elements → Elements → Delete).
In the delete tool the same three shapes are available as for selecting: rectangle (left mouse button or Ctrl), lasso (Alt) and polygon (Ctrl+Alt). All elements that are hit are removed immediately – both mouse buttons act the same way here. The mouse pointer shows the respective shape with an X.
Line tools
For lines and straight lines the context menu of the right mouse button offers the entry Edit (R), the submenu Line and the entry Connect.
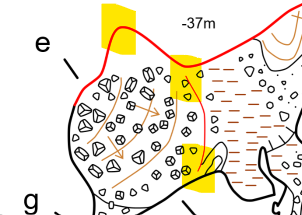
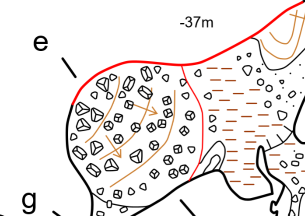
Editing points
Dragging individual vertices of a line to another position with the mouse:
- Press the
Rkey (or right mouse button → Edit (R)) - Press the left mouse button close to the vertex and drag it to the new position
- The vertex nearest to the mouse press is always dragged – if several lines are selected, the nearest vertex across all selected lines counts
- If no line is selected, the line under the mouse pointer is selected. If there is none, a crosshair appears and the next click on a line selects it and grabs its nearest vertex straight away
- For lines with a curve share, the smoothing is recalculated after every drag
Escends the tool and switches back to the tool you called it from – Draw, Move or otherwise Select
Inserting and deleting points
Adding or removing a vertex:
- Select the line (
Wkey) - Place the cursor at the position concerned
- Right mouse button → Line and choose:
- Insert Point – the new vertex is created exactly at the cursor position. Which segment takes it is decided by the shortest distance; if the cursor is beside the line, the line gets a kink there
- Delete Point – the vertex nearest to the cursor is removed and the line is smoothed again
After both, the Edit tool is active – so you can drag the point on straight away.
Clipping and separating lines
Shorten or divide a line at the cursor position:
- Select the line or straight line (
Wkey) - Place the cursor at the position where the cut should be made
- Right mouse button → Line and choose:
- Clip Short Side – the shorter piece is removed
- Clip Long Side – the longer piece is removed
- Separate – the line is divided into two lines; the longer side stays selected
The remaining line stays selected – so you can carry on clipping straight away.
Connecting lines
Merging two lines into one line:
- Select both lines (Elements → Elements → Select or the
Wkey) - Right mouse button → Connect
- The nearest points are always joined together
- One point is omitted from one line so that no spike is created at the joint
- If only one line is selected, the line under the mouse pointer is added as the second one
- The combined line stays selected – you can select the next line straight away and append it
Scale and zoom
Setting the drawing scale
The scale affects the width of the lines shown on the screen and the size of the symbols:
- Go to Drawings → Drawing → Scale
- Choose a scale from 1:10 to 1:100000
Displaying the drawing grid
A drawing grid helps with the alignment:
- Press G or go to Drawings → Drawing → Grid
- The grid adapts to the zoom factor (0.1 m, 1 m, 10 m, 100 m, ...)
- The grid spacing is shown at the top left
Zooming
Navigating in the drawing:
- Mouse wheel or zoom gesture: zoom in/out
- Right mouse button → move: pan the view
- Drawings → Drawing → Overview (
Ctrl+Shift+Z): show the whole cave plan
At a smaller zoom certain elements are hidden, so that only wall lines and survey shots are shown.
Several caves and plans across caves
For overview plans that show several caves:
- Select several caves in the cave table
- Use Calculate → North → UTM Grid as the alignment
- Draw the drawing (it is stored in the topmost selected cave)
Exporting and importing drawings
Drawings can be saved and loaded separately (e.g. for teamwork):
- Right-click on the drawing in the table
- Choose Export (saves it as an XML file)
- Later: Import (loads the drawing into this file)
This way several people can work on different levels and the finished drawings can be merged.
Teamwork
CaveRenderPro stores everything in a single XML file. There is no built-in multi-user capability (no locking, no merging). But with good planning teamwork works very well!
Proven model: one cave per person
The most robust model for teams:
- Every person works in their own CaveRenderPro file (only their own cave(s))
- One coordinator manages the master file
- Regularly: (e.g. monthly) import the individual caves into the master file
- Workflow: person A sends their cave as an XML export → the coordinator imports it into the master file
Splitting drawing levels for shared plans
If several people draw in the same caves, use separate drawing levels:
- Person A: draws passage 1
- Person B: draws passage 2
- Person C: draws the border and the legend
Every person exports their finished drawing → the coordinator imports all of them into the master file.
Working principles for professional plans
- Use levels: separate survey shots, outline, fill, labels and legend
- Keep the scale consistent: set all drawings to the same scale
- Use symbols correctly: use the UIS symbol database
- Keep the text legible: not too small, a good font
- Use a sketch: field sketches save time when drawing
- Save regularly: the drawing is saved together with the file
Keyboard shortcuts for drawings
The most important shortcuts for working quickly:
| Shortcut | Function |
|---|---|
| Q | Activate the draw mode (draw elements) |
| W | Select/mark an element |
| Ctrl + left/right mouse button | Select elements by rectangle / remove them from the selection |
| Alt + left/right mouse button | Select elements by lasso / remove them from the selection |
| Ctrl+Alt + left/right mouse button | Select elements by polygon / remove them from the selection |
| E | Move an element |
| Shift (hold) | Move temporarily without switching tools |
| T | Change the text |
| F / B | Elements to the foreground / background |
| I | Invert the line symbols |
| G | Show/hide the drawing grid |
| Ctrl+Z or Esc | Undo the last action |
| Ctrl+Y | Redo the last action |
| K | Display the sketch |
| Ctrl+K | Modify the sketch (move) |
| Ctrl+L | Mirror the sketch |
| Alt+mouse wheel | Rotate elements or the sketch (slowly) |
| Shift+Alt+mouse wheel | Rotate elements or the sketch (quickly) |
| Ctrl+mouse wheel | Scale elements or the sketch (slowly) |
| Shift+Ctrl+mouse wheel | Scale elements or the sketch (quickly) |
| Ctrl+C / Ctrl+V | Copy/paste elements (also between windows) |
| Del | Delete the selected elements |
| Mouse wheel | Zoom in/out |
| Ctrl+Shift+Z | Centre the drawing (overview) |
| Ctrl+W / Ctrl+E | Open the tab Drawings / the tab Elements |
Frequently asked questions
Q: How do I align the sketch perfectly?
A: With Ctrl+K you can move the sketch. With Alt+mouse wheel you rotate it. Use the grid (G key) to check the alignment.
Q: Can I copy drawings between files?
A: Yes! Use Export (save as XML) and then Import into the other file. Or with Ctrl+C/Ctrl+V you can copy survey shots and elements between two open CaveRenderPro windows.
Q: Why is my drawing so small?
A: The scale is probably too large (e.g. 1:2500 instead of 1:500). Go to Drawings → Drawing → Scale and choose a smaller scale.
Q: How does a group work on one plan?
A: Every person works in one drawing in their own file. The finished drawing is exported and the coordinating person imports all the drawings into the master file. Or: create several drawings in one file and every person edits their own level.
Q: Filling a passage does not work — why?
A: The passage has to be completely surrounded by lines (no open corners). If it does not work, use "Wall line for small zoom factors" to close the gaps.
Next steps
Now you have created professional plans. The next chapter shows you how to print and export them:
- Printing & export – printing plans, SVG/PDF export, Google Earth, GPS devices